How to combine a mosaic plot with a xyplot?
我正在尝试重现这个情节:
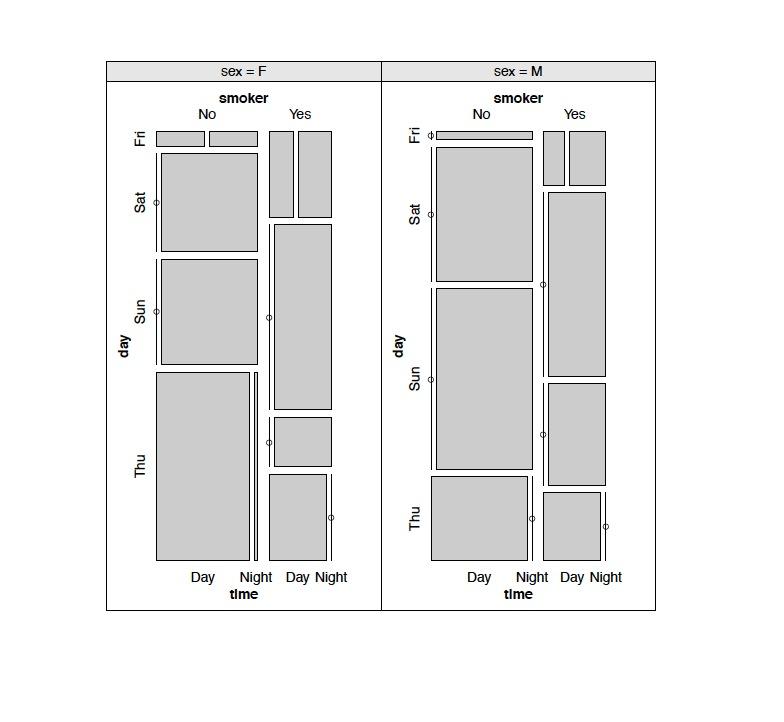
它看起来像图书馆格子中的 xyplot,但我找不到将马赛克图与 xyplot 结合起来的方法。
有人知道怎么做吗?
您只是在寻找 vcd:::cotabplot
中内置的面板功能
|
1
2 3 4 |
library(vcd)
data(“alzheimer”, package =”coin”) alz <- xtabs(~smoking + disease + gender, data = alzheimer) cotabplot(~ smoking + disease | gender, data = alz, panel = cotab_coindep, n = 5000) |
示例 http://img844.imageshack.us/img844/8407/1l6d.jpg
- 您可能还会对”面板”采用的不同参数感兴趣。这是帮助文件:rss.acs.unt.edu/Rdoc/library/vcd/html/cotab_panel.html
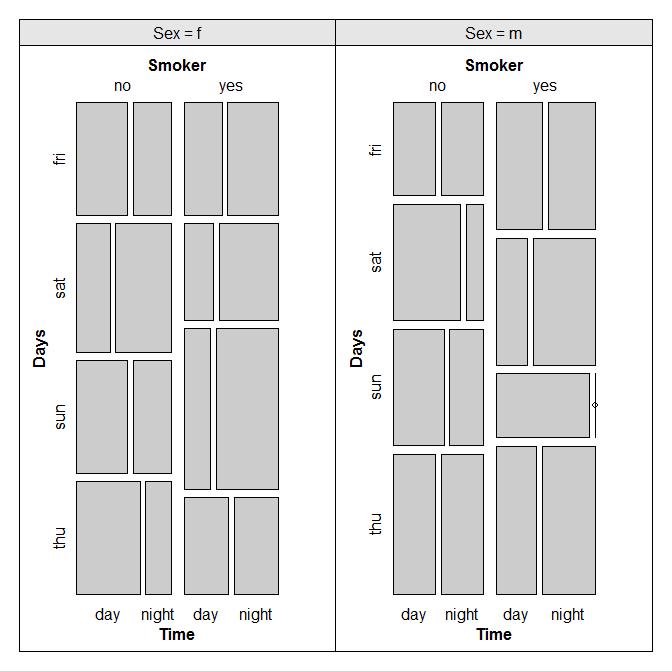
这里是潜在数据的模拟:
|
1
2 3 4 5 6 7 |
Smoker <- sample(c(“yes”,”no”), 100, T)
Days <- sample(c(“thu”,”fri”,”sat”,”sun”), 100, T) Time <- sample(c(“day”,”night”), 100, T) Sex <- sample(c(“m”,”f”), 100, T) Value <- sample(1:10, 100, T) DF <- data.frame(Value, Smoker, Days, Time, Sex) |
绘图是使用包 vcd:
生成的
|
1
2 3 |
library(vcd)
cotabplot(~ Smoker + Days + Time | Sex, data = DF, panel = cotab_mosaic, direction =”v”) |
编辑:上传情节:
来源:https://www.codenong.com/19334311/