Using loops to create multiple matplotlib graphs with dual y-axes
我正在尝试使用 matplotlib 创建许多时间序列图,以使用循环来销售不同种类的水果及其平均销售价格。每个图表都具有以下相同的特征:
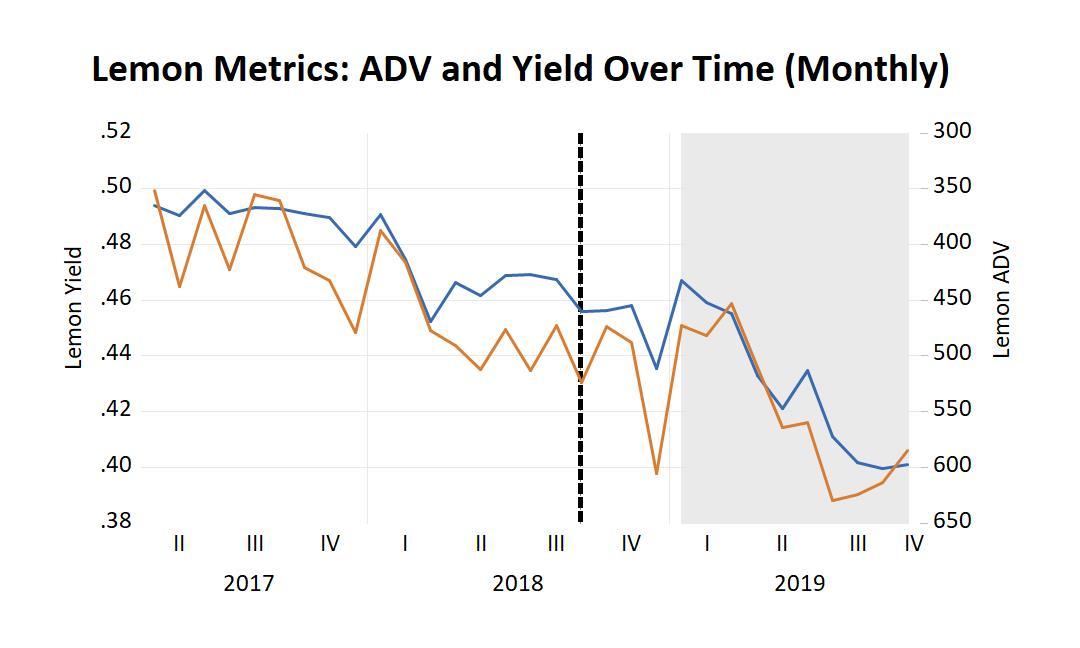
- 左侧 y 轴的售价(收益率),右侧 y 轴的每日销售量(ADV)
- x 轴上的时间(月)
- 标有每个 y 轴系列的图表标题
- 阴影(代表预测)
- 垂直参考线(代表业务规则的变化)
这是一个示例:
我写了一些 matplotlib 代码来创建一个图形,它工作正常。现在我想使用代码并使用循环为许多水果产品创建相同类型的图表,而无需创建每个 1×1,因为模板是相同的,只是每个图表中的标题和绘制的系列发生了变化。代码没有运行,它甚至没有给出错误信息。如何解决?
|
1
2 3 4 5 6 7 8 9 10 11 12 13 14 15 16 17 18 19 20 21 22 23 24 25 26 27 28 29 30 31 32 33 34 35 36 37 38 39 40 41 42 43 44 45 |
import matplotlib.pyplot as plt
import pandas as pd import numpy as np plt.style.use(‘seaborn-whitegrid’) # Set figure Size x_col =”date” for x_col in y1_col and y2_col: # Graph title # set x label which is common / set left y-axis label / set labelcolor and labelsize to the left Y-axis # plot fruit Yield on left Y-axis; invert axis # twinx sets the same x-axis for both plots / set right y-axis label / set labelcolor and labelsize to the right Y-axis # plot fruit ADV on right Y-axis, format with comma separator |
您可以使用 plt.subplots(),它返回一个图形和轴对象的元组。在这种特殊情况下,轴将是一个形状数组(行 x 列)。您可以将每个项目分配到适当的轴位置,如下所示:
|
1
2 3 4 5 6 7 8 9 10 11 12 13 14 15 16 17 18 19 20 21 22 23 24 25 26 27 28 29 30 31 32 |
rows=len(y1_col) #set the desired number of rows
cols=2 #set the desired number of columns fig, ax = plt.subplots(rows, cols, figsize=(13,8),sharex=False,sharey=False) # if you want to turn off sharing axis. ax[row][col].plot(df2[x_col], df2[y1_col[item_num]], color=’red’,linewidth=3.0) ax[row][col].set_ylabel(‘Yield (inverted scale)’, color=’red’,size=’x-large’)
ax[row][col].tick_params(axis=’y’, labelcolor=’red’, labelsize=’large’)
axp = ax[row][col].twinx()
col=col+1 plt.show() |
- 谢谢…当我运行您的代码时,我收到一条错误消息,指出”未定义名称’y1_col'”。我该如何解决?
- 您在代码中定义了它: y1_col = [“apple_yld”,”banana_yld”,”pear_yld”]
- 这看起来不错!两个快速跟进:(1)您如何编写代码以包含 3 个图表中的每一个的自定义标题:Apple Trends、Banana Trends、Pear Trends 和(2)如何将图表制作为单独的图表而不是在格子喜欢时尚?当我查看它们时,它们看起来有点挤压。
- 乐于帮助。如果您发现答案有帮助并且解决了您的问题,您需要检查绿色标记。这有助于将注意力集中在未回答的问题上。对于您的后续问题:1)检查每个轴元素的 set_title 选项,例如ax[row][column].set_title 2) 您可以通过适当调整 plt.subplots() 中的 figsize 来调整绘图大小。
来源:https://www.codenong.com/60973115/